The headline arrives with the confidence of somebody who has already ordered champagne: millennials are going to become the richest generation in history. It sounds wonderful. I would like a delivery estimate, a tracking number, and a brief explanation of why the group chat has not been informed.
There is a real story underneath the celebration. Older households hold substantial assets, and some of that wealth will eventually pass to younger relatives. Investment values and housing equity also change over time. As a generation ages, its combined balance sheet can grow enormously. None of those observations, however, tells us what will happen to the person standing in line at the grocery store, mentally subtracting the total before the cashier finishes.
The claim becomes useful when we slow it down. Richest by what measure? In which country? At what age? Are we talking about assets already owned, a forecast of future inheritances, or the amount of money available to deal with next month's expenses? Those questions take a little shine off the headline, but they reveal a much more interesting story.
Wealth needs a definition before it gets a crown
Economists usually measure household wealth as net worth: assets minus liabilities. A home, retirement account, investment portfolio, or business can contribute to the asset side. Mortgages and other debts belong on the other side. Income is different. It is a flow of money over time, while net worth describes a balance sheet at a particular moment.
Imagine a household that owns a home valued at $500,000 and owes $400,000 on its mortgage. Its equity in that home is $100,000, before considering other assets and debts. Calling the household half a million dollars richer because that is the home's price would skip a fairly important part of the arithmetic. The mortgage company would almost certainly notice.
Liquidity introduces another distinction. A house may contribute substantial net worth while providing very little money that can immediately pay for groceries or a repair. Accessing its value might involve selling, borrowing, or changing where the household lives. Retirement and business assets have their own practical constraints. Wealth can be valuable without being easy to spend.
Then there is the difference between a generation's total wealth and the experience of its members. A large cohort can hold a large combined amount because it includes many households. Its total also reflects how old those households are, what they own, and how asset prices have moved. A single enormous number cannot tell us how evenly its benefits are spread.
Average is doing a lot of work
Suppose five imaginary households have net worth of $10,000, $20,000, $30,000, $40,000, and $4.9 million. Together they hold $5 million, so their average is $1 million. Their median, the middle value when the households are ordered, is $30,000. These are invented figures for a calculation, not survey results. They show how a mathematically correct average can feel very unfamiliar to most of the group.
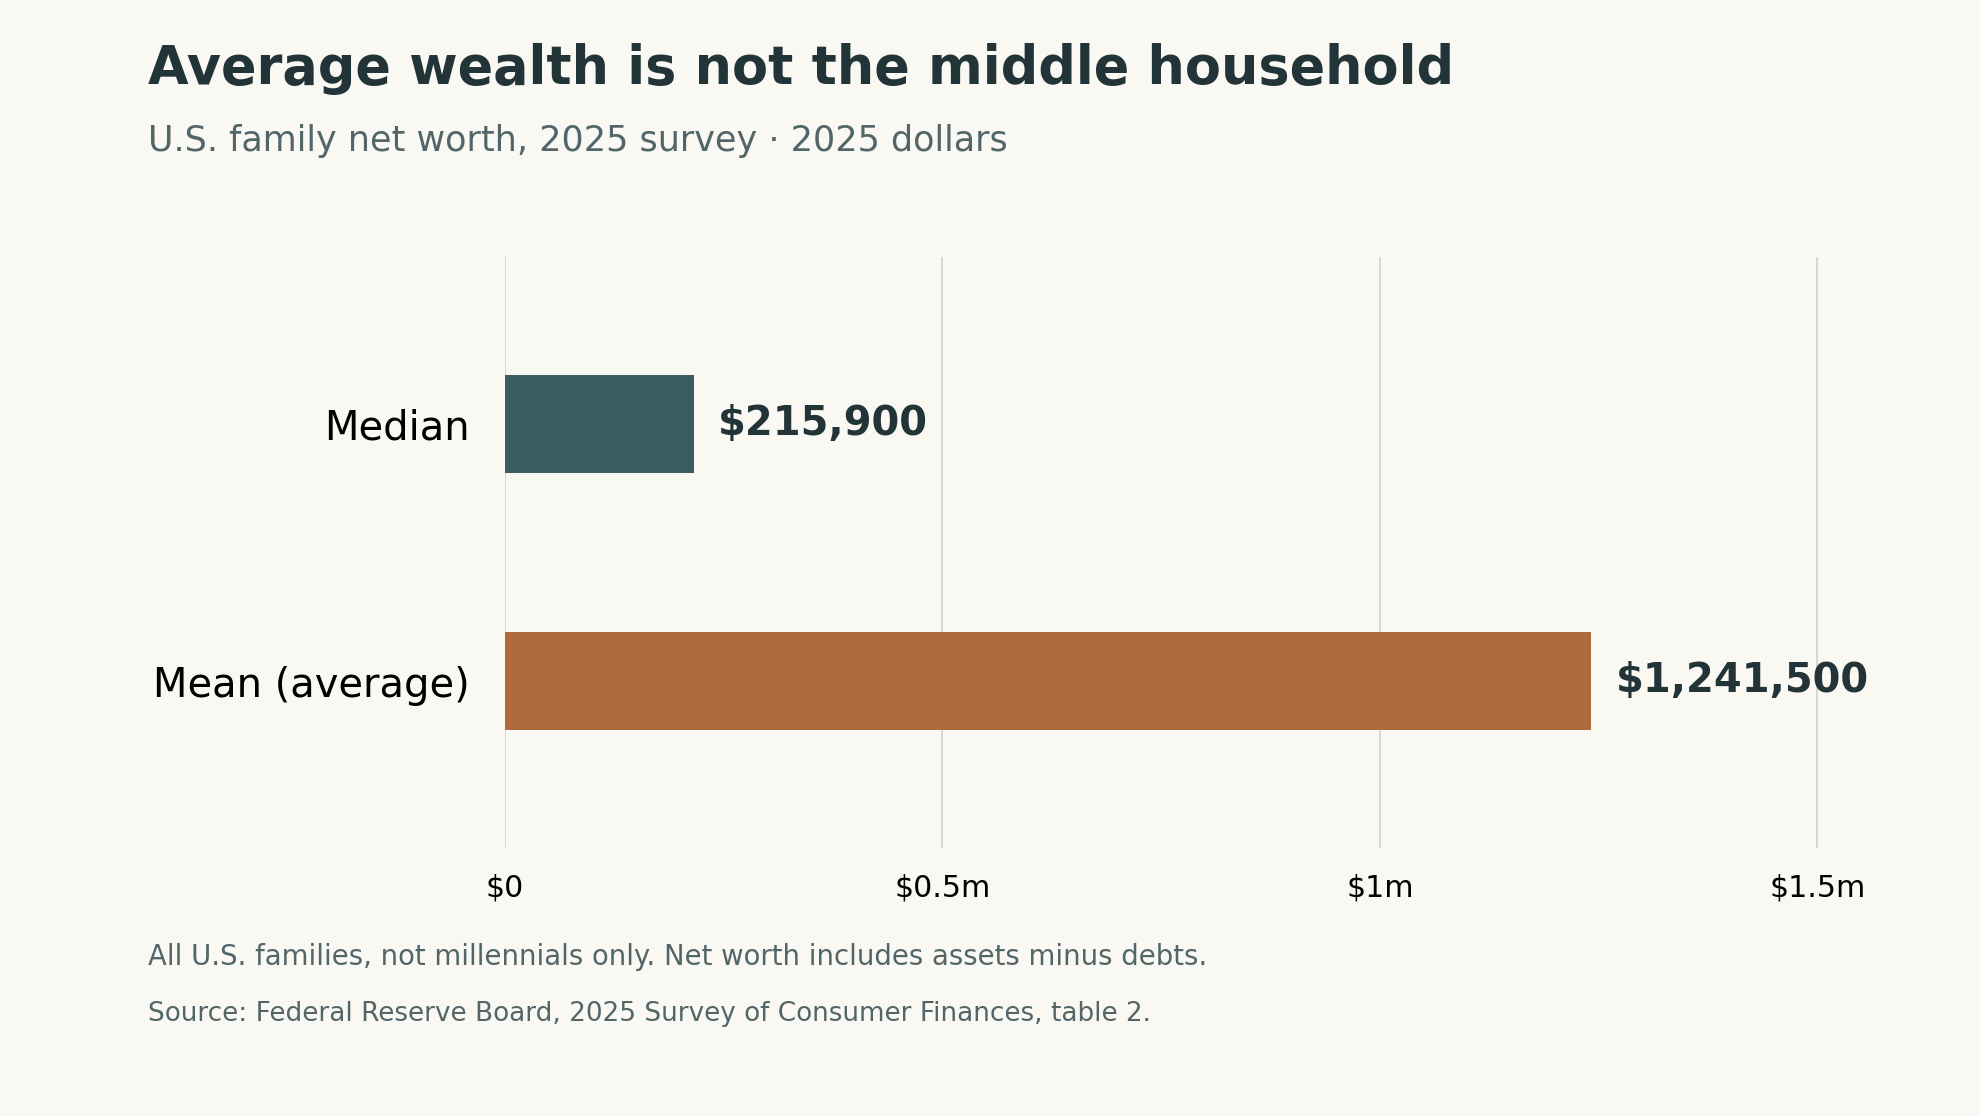
The Federal Reserve’s 2025 Survey of Consumer Finances, released in October 2026, puts all-family median net worth at $215,900 and the mean at $1,241,500, in 2025 dollars. These are not millennial-only estimates. The chart below compares them.
Neither measure is a trick. The average helps describe the total relative to the number of families; the median tells us about the family in the middle of the distribution. We need both when evaluating a claim that shifts casually from “this group holds a lot” to “people in this group are doing well.” That shift is where much of the mirage appears.
The inheritance forecast is large, and it is still a forecast
Cerulli Associates projected in December 2024 that roughly $124 trillion would transfer in the United States through 2048. Its estimate included about $46 trillion going to millennial heirs over that forecast period. The same analysis expected Gen X to receive more than millennials during the nearer ten-year window. The timing matters as much as the impressive total.
This is a forecast from a research firm serving the wealth-management industry. It is not a government promise, a worldwide census, or an amount already deposited into younger households' accounts. Expected transfers depend on the assets available, their future values, family circumstances, and when transfers occur. The headline tends to compress all those conditions into a very confident “will.”
Some assets may first pass to a surviving spouse. Older households may also spend down resources, change beneficiaries, make gifts, or leave money to charity. An inheritance received much later in life serves a different role from help received during an early housing search or the first years of raising children. A valuable transfer can arrive after the decision it might once have changed.
I find that timing especially important. Money has a value on a balance sheet, but it also has a value within a particular moment. Help that prevents someone from leaving a course, missing a housing opportunity, or taking on an expensive obligation can affect what becomes possible afterward. Two families receiving the same amount at different stages may experience very different consequences.
The wealth follows family lines
A large transfer does not imply an equal distribution. Cerulli's forecast expected more than half the transferred volume to originate from high-net-worth and ultra-high-net-worth households, a group representing about 2 percent of households in its analysis. That finding describes the expected source of transfers. It should not be relabeled as a statistic about how much today's top 1 percent of millennials already owns.
The broader implication is straightforward: people with wealthy relatives are positioned differently from people without them. An inheritance can preserve an advantage that began long before the estate was settled. Earlier help with education, housing, or a financial emergency can matter too, even when it never becomes a dramatic story about inheriting a mansion.
Meanwhile, there are families with very little to pass on, and families in which younger relatives provide support to older ones. A story that treats everyone as a future beneficiary misses those directions of care. It can also make ordinary financial difficulty look like a personal failure to prepare for a windfall that was never coming.
The familiar phrase “inheriting debt” needs care as well. In the United States, a deceased person's debts are generally paid from their estate; children do not automatically become personally responsible merely because they are heirs. Shared legal responsibility and other exceptions can apply. The Consumer Financial Protection Bureau explains those distinctions. A reduced or exhausted inheritance is different from automatically acquiring a relative's personal debt.
Generation labels can hide the comparison
Comparing millennials today with baby boomers today mixes generations with stages of life. Older households have usually had more time to earn, save, buy assets, and repay borrowing. A fairer comparison examines similar ages and adjusts for inflation, while recognizing that households formed in different circumstances and faced different economies.
Even the labels need inspection. The Federal Reserve's Distributional Financial Accounts chart groups those born in 1981 or later under its millennial category. That includes Gen Z. A chart using that grouping cannot quietly become a precise statement about millennials alone. The name at the top of a graph can be much simpler than the population beneath it.
A St. Louis Fed analysis published in June 2025 compared younger households, combining millennials and Gen Z, with earlier generations at an average age of about 34. Using fourth-quarter 2024 data and inflation-adjusted averages, it found $1.35 of wealth for every $1 held by boomers at a similar age. This complicates the claim that younger households are uniformly behind. It does not tell us that every younger household, or the median millennial household, is ahead.
New periods can change the picture again. The 2025 SCF reports that median net worth among families with a reference person younger than 35 fell to $33,000, down 23 percent from 2022 in inflation-adjusted terms. This age category is not a fixed millennial cohort. It measures a different population and period from the earlier comparison. A careful account has room for both findings.

Housing can create wealth and make entry harder
A rise in home prices has different implications depending on which side of ownership a household occupies. An owner may gain equity while someone trying to buy faces a larger price. The same market movement can therefore improve one balance sheet and increase another household's entry cost. A favorable aggregate wealth number can contain both experiences.
An increase in housing wealth can therefore be a poor guide to opportunity for somebody who does not own a home. It describes the market value of an existing asset, while the prospective buyer is asking whether they can enter that market at all.
Borrowing terms also matter. Two homes with similar prices can produce different monthly obligations under different interest rates or down payments. Location, income, taxes, insurance, and the condition of the building add further variation. Comparing a parent's purchase price with a current listing is an interesting beginning; it is a very incomplete affordability calculation.
This is why the simple picture of one generation casually buying houses while another wastes money on small pleasures bothers me. A sandwich is visible. The structure of housing access is harder to fit into a joke. We can discuss spending choices without pretending that cutting one modest pleasure automatically supplies a deposit, a lower interest rate, and an available home.
Earnings and wealth are different stories
Claims that millennials universally earn less at the same life stage are too broad. A January 2024 St. Louis Fed discussion of research on college-educated households reported that millennials and Gen X earned as much as boomers, while larger student-loan burdens could impede homeownership and wealth accumulation. That finding concerns the studied group; it does not describe every worker or settle every comparison of earnings.
Inflation adds another layer. More dollars do not necessarily buy more. The Bureau of Labor Statistics explains the use of constant, or real, dollars to compare purchasing power over time. Without that adjustment, a record nominal salary or portfolio can look more impressive than the improvement it buys. An inflation adjustment improves the comparison, though it still does not capture every difference between households' needs or local costs.
Someone can have a good income and little accumulated wealth. Someone else can have substantial assets and modest current earnings. The position of a renter beginning a career differs from that of a homeowner nearing retirement, even if their annual pay looks similar. None of that fits neatly into a single generation being declared the winner.
Financial breathing room deserves its own measure
If we want to understand security, it helps to ask about the ability to handle disruption. In the Federal Reserve's survey of household well-being for 2025, 63 percent of adults said they would cover a hypothetical $400 emergency entirely with cash, savings, or a credit card paid off at the next statement. Twelve percent said they could not cover it by any means. These figures concern adults overall, not millennials specifically.
The difference between “would use cash” and “could pay at all” is important. The remaining 37 percent were not all unable to find $400. Some would borrow, sell something, or choose another method. The survey is useful precisely because it asks more than one question about resilience, rather than converting a complex situation into another alarming shorthand.
For me, financial breathing room is an easier idea to connect to daily life than a distant inheritance total. It means an unexpected bill does not immediately rearrange everything. It means choices are available when something changes. A high net worth can support that freedom, but the timing and accessibility of resources affect how much freedom somebody actually has.
A better ending than a guaranteed fortune
I do not think millennials need to be cast as either doomed or secretly waiting for a universal payday. Some have built substantial wealth. Some will receive large inheritances. Others are managing obligations with very little cushion, and those experiences can exist within the same birth years. We lose something useful every time a generational slogan erases that variation.
The question I want a wealth headline to answer is what has become possible for the people inside the number. Can they find stable housing, absorb a setback, support someone they love, and have a little time left to enjoy being alive? Those outcomes deserve attention alongside the totals. They are also much harder to photograph than champagne.
I would definately welcome a world in which more people have that kind of room. A generation's growing balance sheet might help create it, depending on how resources are distributed and when they arrive. Until then, I will keep reading past the headline. I can appreciate an impressive number and still want to know whose life it actually changes.
Related Reads You Might Enjoy
Why We’re Bankrolling Luxury Brands: The Spending Habits No One Talks About
When Luxury Starts to Burn: Moët Hennessy’s Crisis and the Future of Fine Wine
How the Middle Class Spends on Luxury, and Why It’s Not What You Think
The French Farmer Who Found a $4 Billion Gold Mine, and Lost It
The Rise of the “Average” Millionaire, And Why It’s Not What It Used to Be
The Death of the Penny: Why America’s Smallest Coin Is Finally Getting the Axe
Sources and further reading
Federal Reserve: 2025 Survey of Consumer Finances, table 2; released October 2026
Federal Reserve: Distributional Financial Accounts and generation definitions
St. Louis Fed (June 2025): average wealth comparisons using fourth-quarter 2024 data
Cerulli Associates (December 2024): U.S. wealth-transfer forecast through 2048
Cerulli Associates (June 2025): Gen X and the nearer-term inheritance window
St. Louis Fed (January 2024): earnings, student debt, and wealth accumulation
Bureau of Labor Statistics: purchasing power and constant dollars
Federal Reserve (May 2026): 2025 household survey, emergency expenses, and savings
Consumer Financial Protection Bureau: debts after a death and responsibility exceptions
The neighborhood and inheritance images are AI-generated editorial illustrations. The chart was plotted from Federal Reserve survey data and describes all U.S. families.