If I could choose any year for a historical visit, 536 would require an unusually persuasive travel agent. The daylight looked wrong, growing seasons suffered, and the next several years brought further volcanic shocks. A few years later, plague entered the written record around the Mediterranean. Even with my enthusiasm for a strange story, I’d have some follow-up questions before packing.
That year has become famous as a candidate for the worst time to be alive. The description points toward a real and remarkable climate crisis, but it also encourages a question worth keeping open: worst for whom, and measured how? A farmer facing a failed harvest, a family caught in war, and someone losing relatives to disease experienced disasters through their own circumstances. History gives us evidence to compare; a universal suffering leaderboard would require information we simply don’t have.
What makes 536 so compelling is the way several kinds of evidence meet. Written accounts describe diminished sunlight, ice preserves chemical traces of eruptions, and trees record extraordinary growing conditions. Together, those sources let us investigate a distant environmental emergency. The story becomes more absorbing as the details sharpen, especially when we give the uncertainty its proper place.
How 536 acquired its reputation
In a 2018 Science report, Harvard historian Michael McCormick identified 536 as the start of an exceptionally difficult period and a strong contender for that grim distinction. The article helped carry the year far beyond specialist discussions. An unfamiliar date suddenly offered a memorable answer to a very familiar question about how bad life could get.
I understand why the label stuck. A year when the sunlight changes feels different from an ordinary piece of chronology. The sky is part of the background we expect to behave itself, which is a fairly modest request considering how many other things need supervision. Yet the phrase “worst year” remains a historical judgment. It wasn’t the result of a study assigning every year a comparable global misery score.
The date also works as an opening chapter. An eruption in 536, another major event in 540, and evidence for further volcanic forcing later in the decade belong to a sequence. The first recorded outbreak of the Justinianic plague came in 541. Keeping those dates separate helps us understand why a single year became shorthand for a much longer stretch of difficulty.
The sun remained in the sky
Contemporary testimony includes Procopius’s account of sunlight lacking its usual brightness. Such observations are valuable because they describe something people actually noticed. They deserve to be read as historical testimony, with attention to translation, location, and the writer’s perspective. A description of a dim sun can be powerful without becoming a literal claim that daylight disappeared everywhere.
It helps to picture altered daylight rather than a planet plunged into continuous night. An atmospheric veil can reduce the sunlight reaching the surface while the sun continues to rise and set. People in different places would have experienced different conditions, and the surviving accounts represent only part of the world. The evidence supports an exceptional disturbance; imagining every village beneath an identical black sky adds certainty the sources can’t provide.
For anyone relying closely on a growing season, unusual sunlight and cold would have been alarming in practical ways. A crop needs suitable conditions over time, and a household has to make decisions before it knows how the season will finish. That gap between noticing trouble and knowing its outcome is one of the most unsettling parts of the story to me.
What volcanoes can do from a great distance
Large explosive eruptions can inject sulfur dioxide high into the atmosphere. As the U.S. Geological Survey explains, that gas can form fine sulfate aerosols in the stratosphere, increasing the reflection of sunlight and producing cooling at the surface. Ash is a dramatic part of an eruption, but the longer-reaching climate effects depend substantially on those sulfur-derived particles.
That distinction changes the picture. The lasting influence can extend far beyond the area covered in falling ash, connecting an eruption to growing conditions in distant regions. Its strength depends on factors including how much sulfur reaches the stratosphere, where the eruption happens, and atmospheric circulation. “A volcano erupted” is the beginning of a climate explanation, with several important details still to establish.
The exact volcanic sources behind the sixth-century events remain a subject of investigation. Iceland has featured prominently in accounts of the 536 event, but I’d treat a confident identification of a specific culprit cautiously. The evidence for volcanic forcing is stronger than our ability to supply every eruption with a fully settled name and location. A good mystery can survive having an honest boundary around what’s known.
The evidence stored in ice
Polar ice accumulates in layers and can preserve sulfate deposited after eruptions. Scientists use such records to reconstruct past volcanic activity, while carefully working out when each layer formed. Michael Sigl and colleagues’ 2015 Nature study revised volcanic chronologies across the past 2,500 years and helped align eruption evidence with episodes of cooling. Dating is central to the argument: two events have to line up reliably before we can evaluate their relationship.
Tiny particles of volcanic glass, where available, can add clues about an eruption’s source through their chemical composition. Different measurements answer different questions. A sulfate peak can indicate volcanic influence, while glass chemistry may help narrow the source. Neither should be treated as a complete account of everything that happened afterward, from harvests to political decisions.
I love that a frozen archive can help explain a sentence written centuries ago. The excitement comes from the comparison: a physical record and a written observation can reinforce each other while keeping their separate limitations. It’s patient work, and it gives an old account a much richer setting than simply filing it under “people used to say dramatic things about the weather.”
The evidence growing inside trees
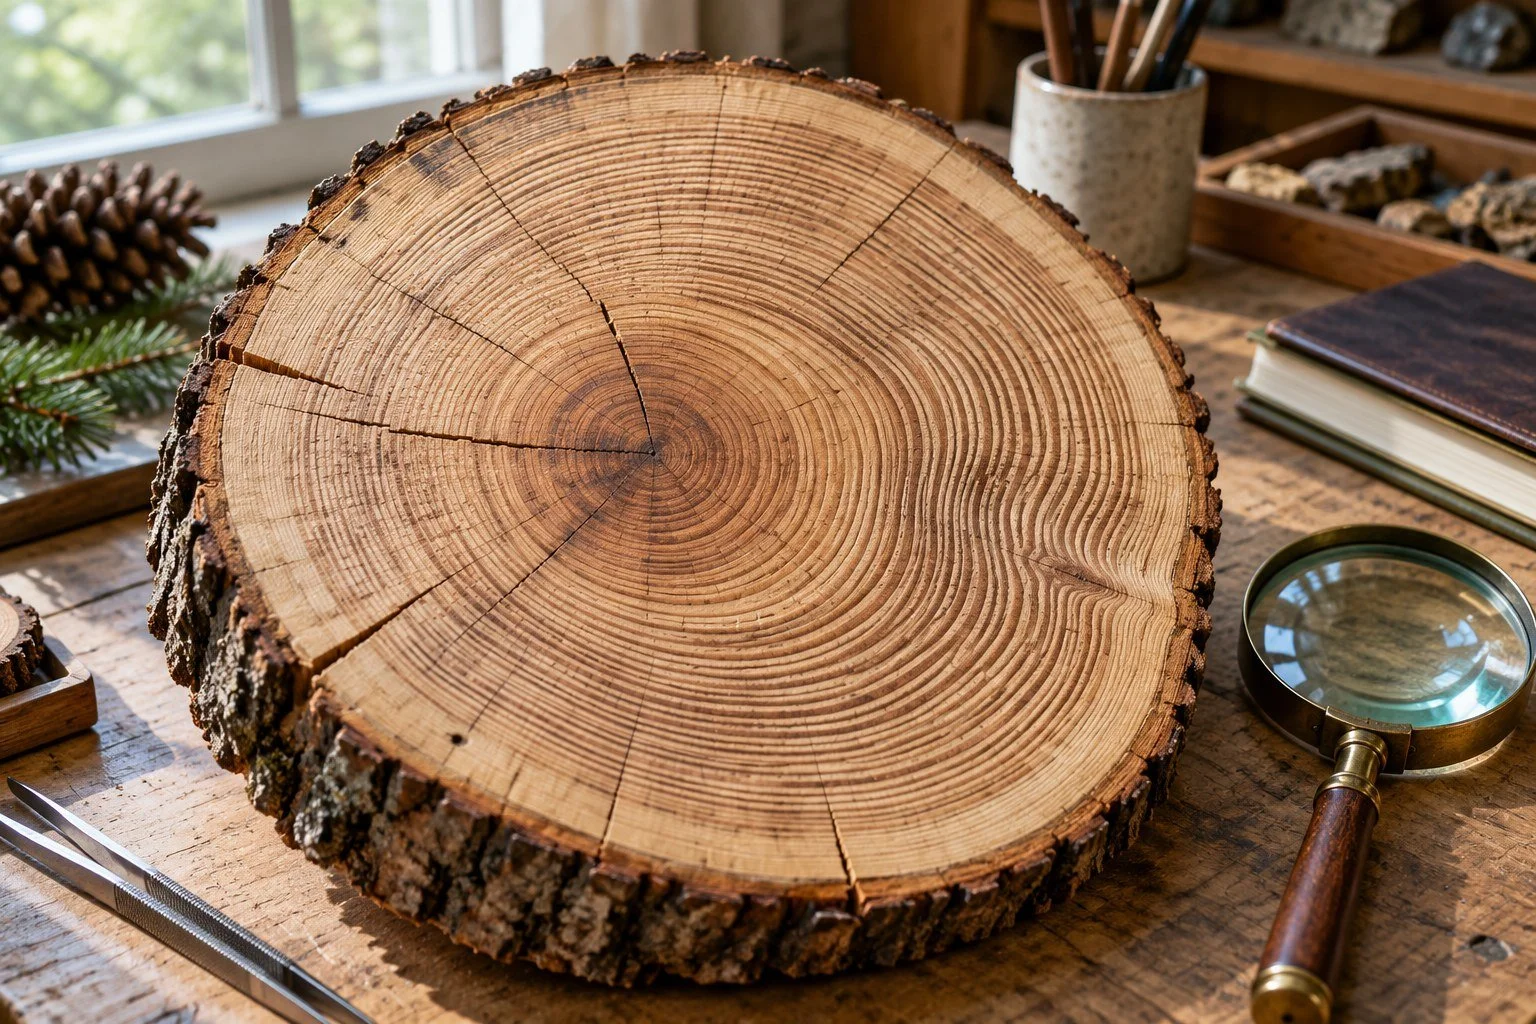
Trees offer another record. Growth rings can preserve responses to environmental conditions, and researchers compare many samples to build dated chronologies. At sites where growth is strongly limited by summer temperature, those records help reconstruct past summers. The work depends on understanding the tree species and setting, rather than treating every narrow ring as an automatic thermometer reading.
Ulf Büntgen and colleagues combined tree-ring evidence from the European Alps and Russian Altai in a 2016 Nature Geoscience study. They identified marked cooling after a cluster of eruptions and proposed the term Late Antique Little Ice Age for a period extending from 536 to around 660. The name describes a reconstructed climatic interval, with seasonal and regional patterns that need examination.
That interval has also prompted debate. A 2017 published critique argued for a shorter duration of large-scale Eurasian cooling; the original authors defended a longer cold phase while acknowledging variation across space and time. This exchange matters because “a century of cooling” can easily turn into “a century when the sun never returned” in a retelling. The research supports a much more specific and interesting discussion of changing summer conditions.
A harvest depends on where it grows
A colder summer can have severe consequences near the limits of cereal cultivation. Temperature, rainfall, crop choice, and the timing of frost all influence whether grain reaches maturity. Food supply then depends on storage, exchange, access to land, and the ability to obtain help elsewhere. The physical shock and the social circumstances belong in the same investigation.
A 2023 Climate of the Past study examined the 536 and 540 volcanic events in Scandinavia, with particular attention to southern Norway. Its modeling and agricultural analysis showed why growing-season effects and local conditions matter when evaluating the risks to cereal production. Regional research like this gives us a more useful scale than assuming every field across a continent failed in exactly the same way.
To imagine the stakes, consider a household dividing grain between food and the seed needed for another season. A disappointing harvest could narrow both choices at once. That’s an illustrative situation, rather than a surviving diary entry, but it helps explain why repeated poor seasons could be so difficult. Recovery requires something to carry forward, and the next growing season arrives on its own schedule.
My garden gives me a very modest appreciation for how much confidence can be invested in a plant that has agreed to absolutely nothing. A stubborn tomato is an inconvenience in my circumstances. For a community depending heavily on its harvest, the same uncertainty sits much closer to the center of daily life. The difference in consequences deserves respect.
Then plague entered the record
The Justinianic plague is conventionally dated from 541, several years after the first volcanic shock discussed here. Ancient DNA research has confirmed Yersinia pestis in remains associated with the First Pandemic. A 2019 PNAS study analyzed genomes from sites across western Europe, providing direct evidence for the bacterium’s presence and diversity during that period.
Identifying the pathogen answers an important question, while leaving others open. It doesn’t tell us the total number of deaths across an empire, the proportion of every town affected, or the economic outcome in each region. Those questions require further evidence and careful comparison. A laboratory result can establish something very specific without settling the entire historical narrative around it.
Mortality estimates and the pandemic’s wider importance remain debated. A separate 2019 PNAS paper by Lee Mordechai and colleagues challenged sweeping accounts of catastrophic Mediterranean-wide impact, drawing on multiple types of evidence. Their argument doesn’t erase suffering in affected places. It asks whether the available records justify extending the most dramatic accounts into a single story about every region.
Climate stress, food insecurity, and disease can be studied together, but a sequence of dates alone doesn’t prove a simple chain of causation. Establishing that the eruption caused a particular outbreak, or that famine explains its full severity, requires more than placing the events beside one another. I find the overlap compelling enough to investigate without giving coincidence the authority of a demonstrated mechanism.
Empires have complicated lives
Political change adds another layer of difficulty. States contend with military campaigns, taxation, leadership, trade, disease, and environmental conditions together. Climate research can help identify an additional pressure, while historians examine how particular societies responded. The same weather shock can meet very different systems of food distribution and power.
A volcanic explanation becomes less useful when it tries to do every job. The Western Roman imperial government had already ended in the fifth century, and the Eastern Roman state continued long after the sixth-century crisis. Treating 536 as a universal switch that immediately dismantled all the surrounding empires compresses distinct histories into one dramatic scene. Following their different chronologies gives us a better account of what changed and when.
Could an eruption alter climate again?
We have a modern example in Mount Pinatubo’s 1991 eruption in the Philippines. USGS documents the enormous sulfur dioxide injection and a temporary global cooling of roughly half a degree Celsius over the following period. That example demonstrates the atmospheric mechanism with observations from the instrument era. It also shows why an eruption’s effects deserve to be considered in their own setting.
Present-day monitoring, scientific communication, public health, and food distribution change the possibilities for response, while disruption can still spread through connected systems. Understanding older events helps us ask useful questions about resilience, including how supplies move and how communities receive support. It gives us something more practical to consider than assigning a distant catastrophe to the next volcano mentioned in a headline.
A difficult year, with real lives inside it
I’d definately keep 536 on the list of years I’m happy to study from this side of history. Its reputation rests on a serious environmental disturbance, and the following years brought further shocks. The strongest answer to the title is therefore a qualified one: 536 is a powerful candidate, especially as the beginning of a difficult period in parts of the Northern Hemisphere, rather than a proven worst year for everyone on Earth.
What stays with me is the scale of the connection. Material released into the atmosphere could affect distant summers; altered growing conditions could reach into storage rooms and meals; traces of those changes could remain in wood and ice for us to examine much later. The people living through it had their own concerns and choices, far more immediate than the title historians might eventually give their century.
Reading their world carefully feels like the best use of this story. We can recognize extraordinary hardship, admire the work of reconstructing it, and leave room for the many lives the surviving records only partly reveal. The date catches our curiosity. The evidence brings us closer to what being alive then might actually have meant.
Related Reads
The Carrington Event: The Solar Storm That Set Telegraphs on Fire
Why Birds Sing Before Storms: The Secret Symphony of Survival
Feeling Worthless? Here’s Why the Odds of You Existing Are the Most Beautiful Miracle
The Brain’s Lighthouse: How Forgiveness Changes Your Neural Pathways
The Mountains That Breathe Fire: Volcanoes Most Likely to Erupt in Our Lifetime
Sources
Science: The 2018 report behind the “worst year” description
Sigl et al. (2015): Timing and climate forcing of volcanic eruptions
Toohey et al. (2016): Climatic and societal impacts of a volcanic double event
Büntgen et al. (2016): Cooling and societal change during the Late Antique Little Ice Age
Büntgen et al. (2017): Reply to “Limited Late Antique cooling”
van Dijk et al. (2023): Climatic and societal impacts in Scandinavia
Keller et al. (2019): Ancient plague genomes from western Europe
Mordechai et al. (2019): The Justinianic Plague—An inconsequential pandemic?
Image note: The three accompanying images are AI-generated editorial illustrations. The landscape and grain-storage scene are imagined reconstructions, and the tree-ring image represents research in general. They are not evidence of a particular place, household, or dated scientific sample.